
Dash is an amazing dasboarding framework. If you’re looking for an easy-to- setup dashboarding framework that is able to produce amazing plots that wow your audience, chances are that this is your perfect fit. Further it is also friendly to your CPU. The solution I will show here is running simultaneously on the same 5€/month digital ocean instance as the WordPress installation hosting the article you’re reading.
Dash is fully open source, produced by the makers of plotly. So you can host it yourself, at no cost, or alternatively you can buy a service subscription from plotly, the pricelist you find under this link.
In this post we focus on doing things ourselves, so there is no cost, apart from time spent. And, of course, you need a server, running a standard operating system, and some knowledge.
So let’s work on the latter, and try and augment our knowledge.
The code can be found in the following github repository: https://github.com/hfwittmann/dash
The dashboard can be found under this link: https://dashdax.arthought.com/
What’s in the dashboard?
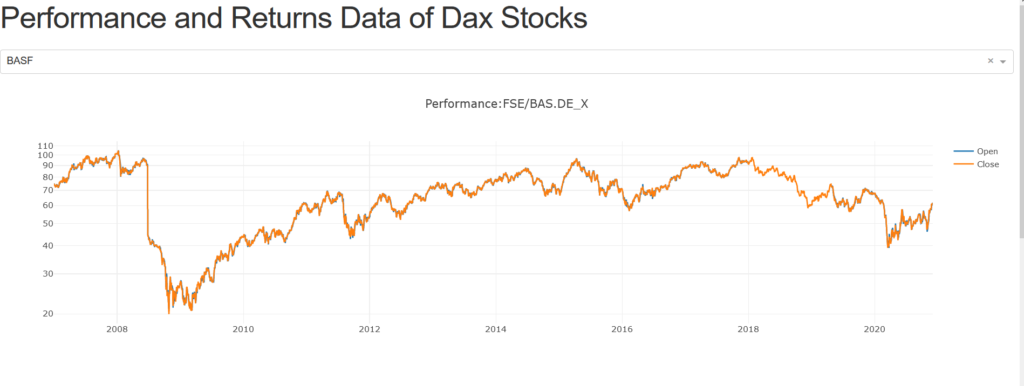
The dashboard’s purpose is to illustrate some stocks’ price changes over the course of time.
The stocks we focus on are all part of the famous German stock index, the DAX. In finance parlance one would say that for the purpose of this post, the DAX is the universe. (Which sounds grand and navel-gazing at the same time, quite an achievement).
And although the DAX name has been there for many decades, its components change on a regular and far more frequent basis.
The current list is shown in this wikipedia article. The list, sourced from wikipedia, forms part of our dashboard.
When you select any of its members, the stock’s detailed price history is displayed in three different plots.
Requirements
Hardware
- A computer with at least 4 GB Ram
Software
- The computer can run on Linux, MacOS or Windows
- Should have docker-compose installed
- Familiarity with Python, preferentially flask
- Basic understanding of docker
- Basic familiarity with webtechnologies
Detail
The three plots shown in the dashboard are
- The price history, using daily prices, in particular open and close
- The returns history, calculated from the price history , again using daily prices, in particular open and close
- A histogram of the returns history, calculated from the price history , again using daily prices, in particular open and close
As typical for plotly plots, with these plots in the dashboard, you have all the usual niceties at your fingertips:
- the ability to zoom
- the ability to select a particular data series
- the ability to export graphics, e.g. in a bitmap format
Components
Dash is based on plotly, flask and react. What are these?
- Flask : …is a smallscale pythonbased webframework which can be used to easily deploy e.g. a microservice, or a website
- Plotly:.. is a open-source graphing tool authored by the eponymous company. It can be used from different packages, e.g. from Python, R and MATLAB. There are a large number of plots available, all share some very nice characteristics. The plots can be used to produce stunning and interactive images, some of which are 3d.
- React: .. is a Javascript based frontend templating framework.
React and angularjs are currently probably the two most popular such frameworks.
Aside : Is React a viable technology (should I invest my time?)
As I had previously used angular, I was interested in the latest trend in the race between these two competitors. A very useful tool to find this out is google trends.
Popularity graph of react vs angular.
Time evolution (Updated 01.01.2021)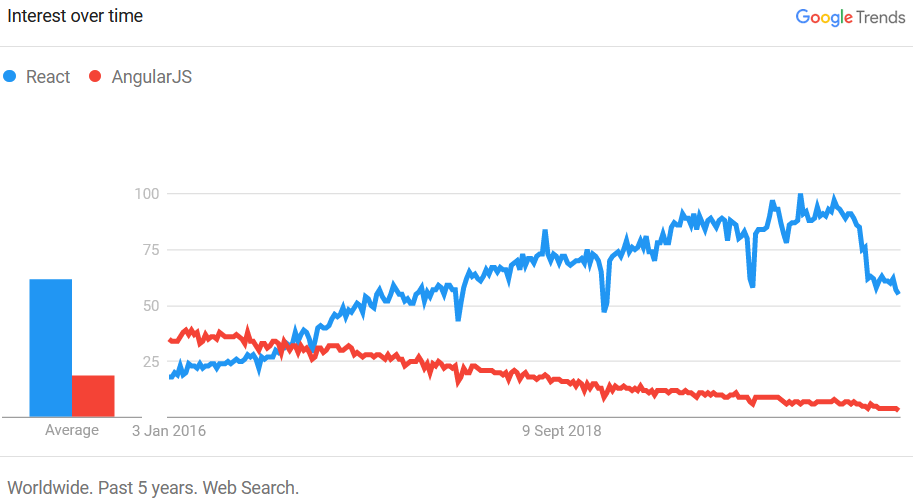
Geographical breakdown (Updated 01.01.2021)
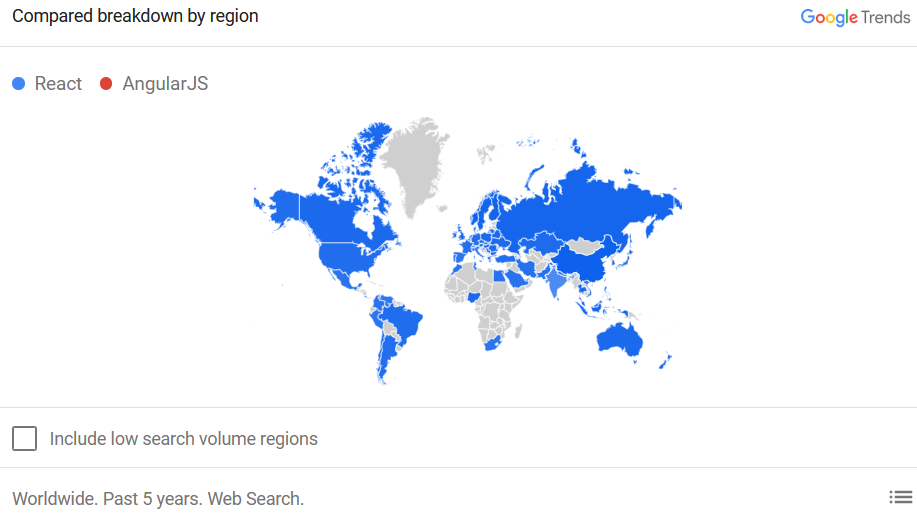
From the interest-over-time-figure it is obvious that, while in previous years search numbers for AngularJS dominated, recently React has caught up, and they now seem tied in a neck-and-neck race. For the purposes of answering my worthiness-question : Yes React is definitely viable and a worthwhile investment of time. (Updated 01.01.2021: React has now overtaken AngularJS .)
Docker
The implementation also makes use of docker. How docker is used to power this website, including https encryption, we have previously covered in a few posts.
We will again use docker compose for dash, and will just need a docker build file, and a few new lines in docker-compose, to accomplish this part.
(Updated 01.01.2021: I have removed the live link and replaced it by static image.)
Code
… for local deployment
The code we present will focus on using a local server with the address being localhost.
There are four files to get this up and running : requirements-dax.txt, dockerfile-dax, docker-compose-dax.yml and app-dax.py.
And here are the file definitions:
- requirements-dax.txt
dash
dash
dash-renderer
dash-core-components
dash-html-components
dash-table-experimentS
plotly
pandas
quandl
lxml
html5lib
BeautifulSoup4
python-dotenv
- dockerfile-dax
FROM python:3
COPY requirements-dax.txt /
RUN pip install -r /requirements-dax.txt
RUN mkdir /myworkdir
WORKDIR /myworkdir
COPY ./ ./
EXPOSE 8050
CMD ["python", "./app-dax.py"]
- docker-compose-dax.yml
version: '3.1'

services:

  dash:
    build:
      context: ./
      dockerfile: dockerfile-dax

    ports:
      - 8050:8050
- app-dax.py
import dash
import dash_core_components as dcc
import dash_html_components as html

import pandas as pd
import plotly.plotly as py
import plotly.graph_objs as go
import os
from dotenv import load_dotenv
load_dotenv()

#cimport cufflinks as cf
# cf.set_config_file(offline=True, world_readable=True, theme='ggplot', colorscale='original')
import quandl

app = dash.Dash('stock-ticker')
server = app.server

app.css.config.serve_locally = True
app.scripts.config.serve_locally = True

external_stylesheets = ['https://codepen.io/chriddyp/pen/bWLwgP.css']

app = dash.Dash(__name__, external_stylesheets=external_stylesheets)

# Start : Global configuration
# Get Table
url = "https://en.wikipedia.org/wiki/DAX"
tables = pd.read_html(url)
constituents = tables[2]
constituents = constituents.drop(columns=[0]).rename(columns=constituents.iloc[0])[1:]
constituents['Quandl Ticker symbol'] = 'FSE/' + constituents['Ticker symbol'] + '_X'
options = [{'label': stockinfo['Company'], 'value': stockinfo['Quandl Ticker symbol'] } for i, stockinfo in constituents.iterrows()]


# Get Data
#### to load the
quandl.ApiConfig.api_key = os.getenv('quandl_api_key')
# End : Global configuration


app.layout = html.Div(children = [

    html.H1(children='''
    Performance and Returns Data of Dax Stocks
    '''),

    dcc.Dropdown(
        id = 'stockticker',
        options = options,
        value = 'FSE/BAS_X'
    ),

    html.Div(id='intermediate-value', style={'display': 'none'}),

    dcc.Graph(id='performance'),
    dcc.Graph(id='returns'),
    dcc.Graph(id='histogram')
])


@app.callback(
    dash.dependencies.Output('intermediate-value', 'children'),
    [dash.dependencies.Input('stockticker', 'value')]
)
def get_data(stockticker):
    mydata = quandl.get(stockticker)

    # only use recent years
    performance_data = mydata.loc['2007':].filter(items=['Open', 'Close'])
    return performance_data.to_json()

@app.callback(
     dash.dependencies.Output('performance', 'figure'),
     [dash.dependencies.Input('intermediate-value', 'children'),
     dash.dependencies.Input('stockticker', 'value')]
 )
def update_performance_graph(performance_data_json, stockticker):

    # label = constituents[constituents['Quandl Ticker symbol'] == stock_ticker_name]['Company']
    # plot plots
    performance_data = pd.read_json(performance_data_json)

    trace_open = go.Scatter(
        x = performance_data.index,
        y = performance_data['Open'],
        mode = 'lines',
        marker = {'colorscale': 'Viridis'},
        name = 'Open'
    )

    trace_close = go.Scatter(
        x = performance_data.index,
        y = performance_data['Close'],
        mode = 'lines',
        marker = {'colorscale': 'Viridis'},
        name = 'Close'
    )

    data = [trace_open, trace_close]

    layout = {
              'title' : 'Performance:' + stockticker,
              'yaxis':{'type': 'log'}
              }

    fig_performance = dict(data = data, layout = layout)

    return fig_performance

@app.callback(
    dash.dependencies.Output('returns', 'figure'),
    [dash.dependencies.Input('intermediate-value', 'children'),
    dash.dependencies.Input('stockticker', 'value')]
)
def update_returns_graph(performance_data_json, stockticker):

    performance_data = pd.read_json(performance_data_json)
    returns = performance_data.diff(axis=0)/performance_data

    trace_open = go.Scatter(
        x = returns.index,
        y = returns['Open'],
        mode = 'lines',
        marker = {'colorscale': 'Viridis'},
        name = 'Open'
    )

    trace_close = go.Scatter(
        x = returns.index,
        y = returns['Close'],
        mode = 'lines',
        marker = {'colorscale': 'Viridis'},
        name = 'Close'
    )

    data = [trace_open, trace_close]

    layout = { 'title': 'Returns:' + stockticker
              # 'yaxis':{'type': 'lin'}
              }

    fig_returns = dict(data = data, layout = layout)

    return fig_returns


@app.callback(
    dash.dependencies.Output('histogram', 'figure'),
    [dash.dependencies.Input('intermediate-value', 'children'),
     dash.dependencies.Input('stockticker', 'value')]
)
def update_histogram_graph(performance_data_json, stockticker):
    performance_data = pd.read_json(performance_data_json)
    returns = performance_data.diff(axis=0)/performance_data

    trace_open = go.Histogram(
        x = returns['Open'],
        marker = {'colorscale': 'Viridis'},
        name ='Open'
    )

    trace_close = go.Histogram(
        x = returns['Open'],
        marker = {'colorscale': 'Viridis'},
        name = 'Close'
    )

    data = [trace_open, trace_close]

    layout = { 'title' : 'Histogram:' + stockticker
            # 'yaxis':{'type': 'lin'}
            }


    fig_histogram = dict(data = data, layout = layout)

    return fig_histogram


if __name__ == '__main__':
    app.run_server(host="0.0.0.0", debug=True)
Let’s walk through those
- requirements-dax.txt: .. specifies which python packages are to be installed inside the docker container. These packages include inter alia the dash package, the plotly package, and the quandl package. The requirements file has a simple purpose: to keep the dockerfile-dax clean. The implementation here has the advantage that it helps to speed up build times during development. The reason is that code changes in the main meat of the program don’t necessitate and effectuate the repeated downloading of the python packages specified in the requirements-dax.txt file. This is because docker can recognize if/that the requirement file has not changed.
- dockerfile-dax : the docker build file. It specifies that the contents of the requirements-dax.txt file, assumed to be residing in the same folder, are to be copied inside of the docker container. Then a pip command is run to install the packages. Furthermore a directory named myworkdir is created inside the container. It is defined as the working directory. The contents of the current directory are then copied inside the container’s working directory. The port 8050 is exposed to the command python ./app-dax.py”
- docker-compose-dax.yml : This docker-compose-file is used to define the use of the docker-file, and to pass on of the port to the outside of the container using the same port number 8050
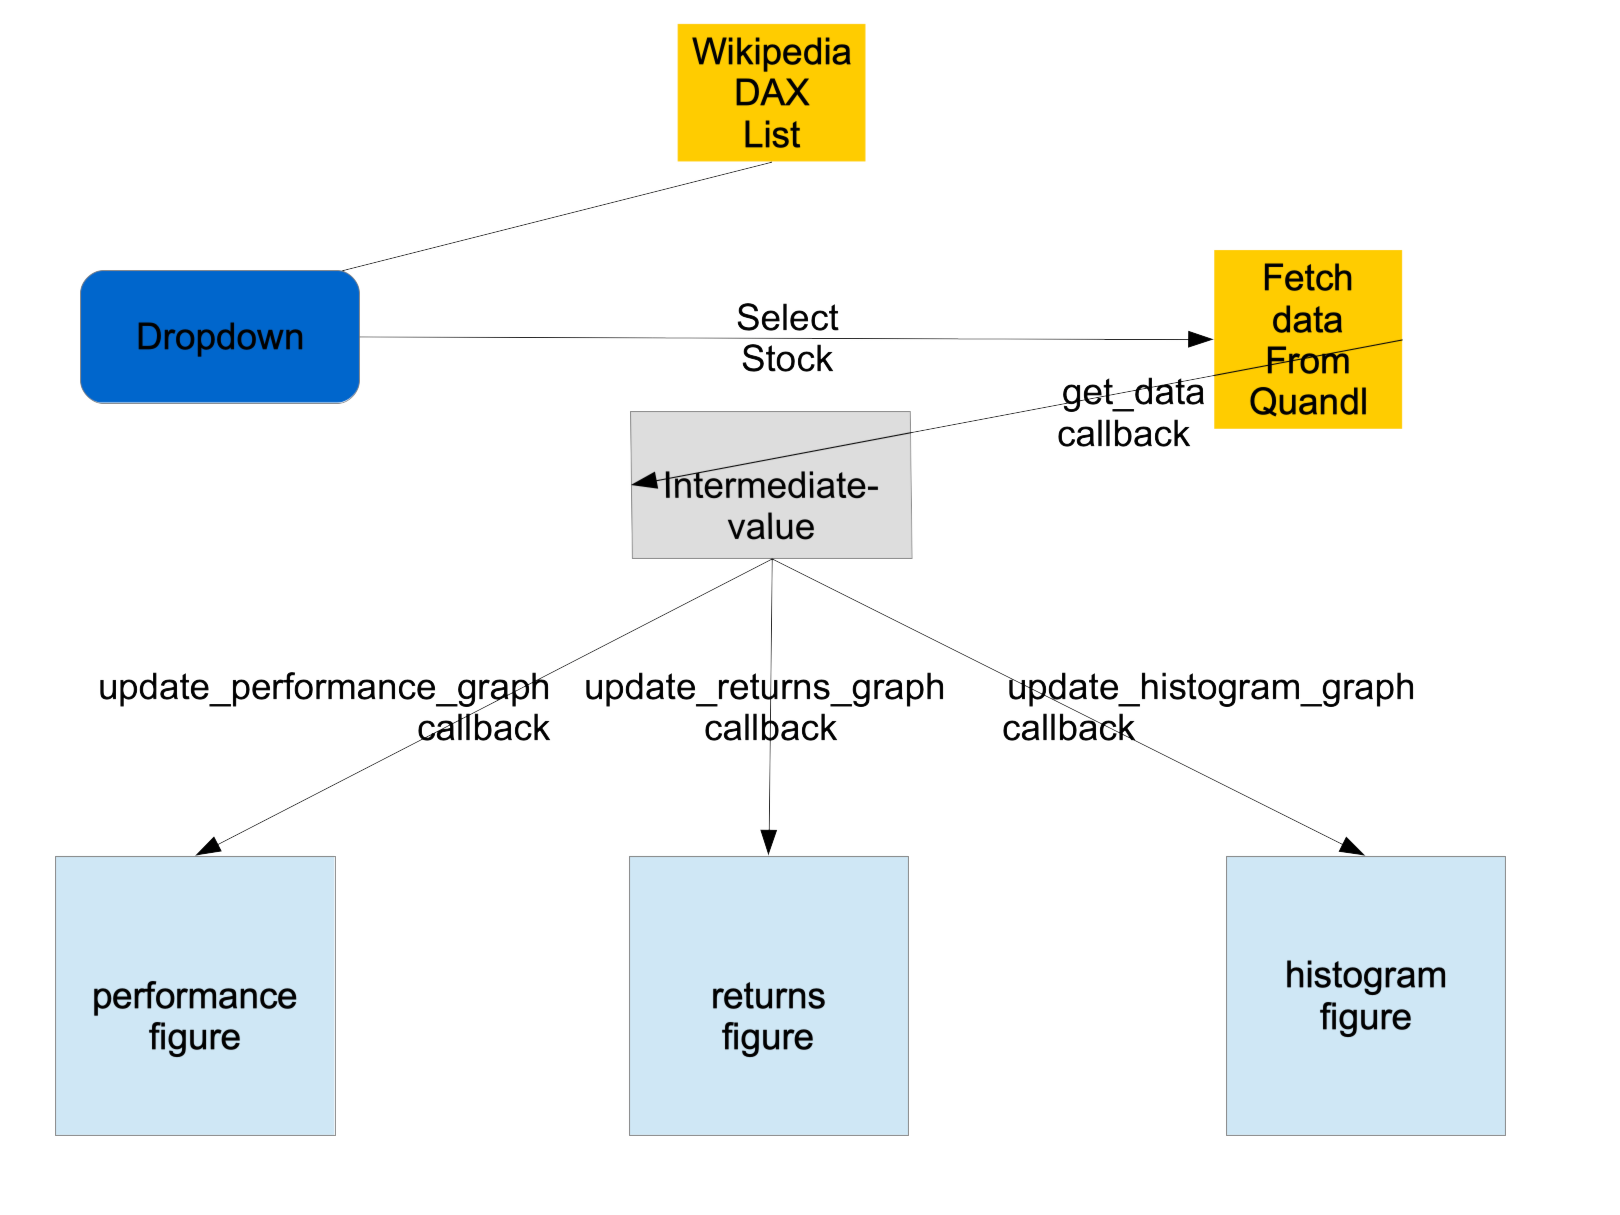
- app-dax.py: The actual meat of the app. The main points here are the definition of the layout using react; and the the definition of some callbacks handling the data transfer. The callbacks are marked by the decorator @app.callback. In this context a callback can handle many inputs but only one output. Here, the three plots all feed from the same data. This data is downloaded from quandl. A download is inherently a slow process, therefore this process should not be done more often than necessary. Therefore this necessitates a trick : The data is put into an invisible element (=intermediate-value), a conduit if you will, which is used as the input in each of the callbacks which in turn trigger the three plots.
So this concludes our post.