
Update March 25, 2023: The code has been updated. See https://arthought.com/new-technology-stack-for-financial-timeseries-dashboard/ for details.
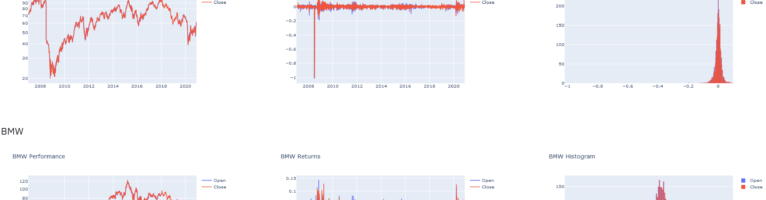
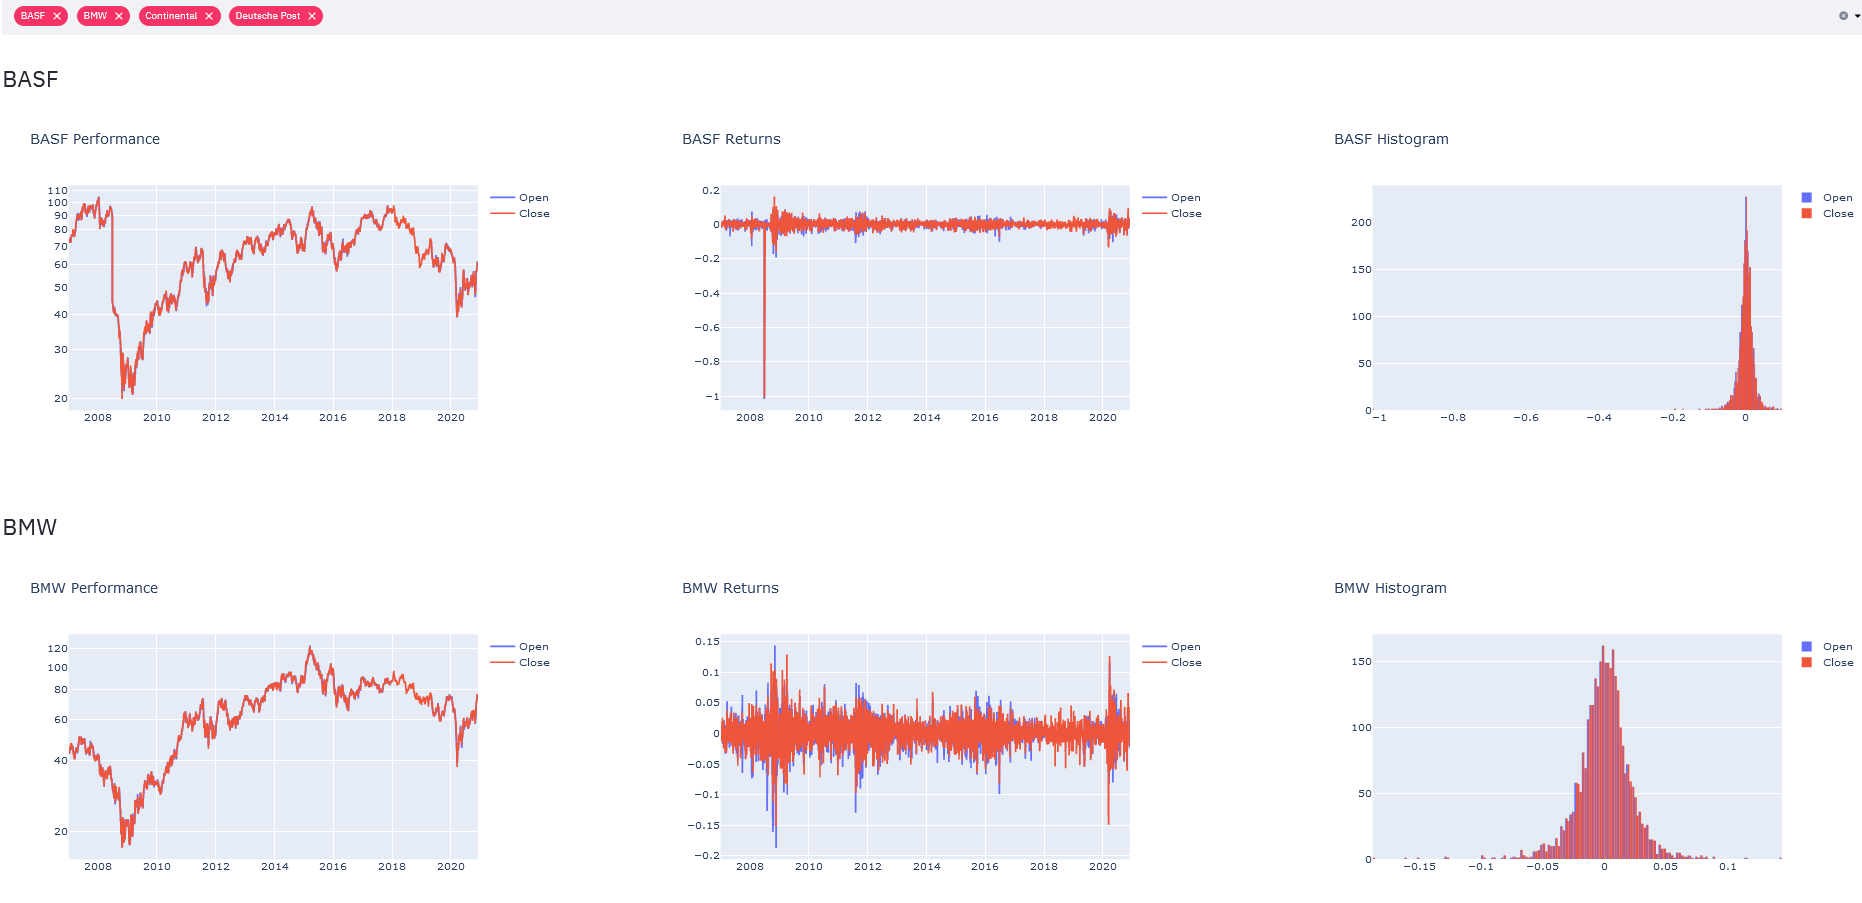
This post is about integrating some very cool technologies to build a dashboard that allows the display of financial timeseries of multiple stocks simultaneously. The data is sourced from Wikipedia and Yahoo Finance. A screenshot of the dashboard we are about to build is presented below.
The dashboard is available at https://dax.arthought.com/, the swagger-ui for the rest-api is available at https://dax-backend.arthought.com/api/ui/#
The focus is on building a pipeline that is robust and easy to maintain. As usual the code is available on github.
Update on 5 Jan 2021: The financial data is now sourced from Yahoo Finance, instead of quandl as it had not updated the timeseries since December 2020. The article and the github have been updated accordingly.
Update on 9 Jan 2021: Added a sector selector a the top of the dashboard for a more thematic preselection of stocks.
What’s in the dashboard?
The dashboard’s purpose is to illustrate some stocks’ price changes over the course of time. This is in fact a topic that I covered previously e.g. in this post: https://arthought.com/dash-for-timeseries/.
- Thematically, what’s in the dashboard?
The stocks we focus on are all part of the famous German stock index, the DAX. And although the DAX name has been there for many decades, its components change on a regular and far more frequent basis. The current list is shown in this wikipedia article. The list, sourced from wikipedia, forms part of our dashboard. When you select any of its members, the stock’s detailed price history is displayed in three different plots.
- Improvements
Today’s post features several improvements
- Easier code, thanks to frontend / backend separation. The frontend is the dashboard, and the backend serves the rest api.
- Backend:
- Clean rest api documentation with swagger
- Clean maintainable datapipe line organisation with d6tflow
- Backend caching with d6tflow
- Frontend:
- Clean, simple code thanks to streamlit and the backend data-serving rest api
- Frontend caching with streamlit
Requirements
Hardware
- A computer with at least 4 GB Ram
Software
- The computer can run on Linux, MacOS or Windows
- Should have docker-compose installed
- Familiarity with Python
- Basic understanding of docker
- Basic familiarity with webtechnologies
Description
This section will focus on various sections of the code. Of course, I recommend taking a look at the entire github repository1. Also or additionally, I recommend keeping open the repository in a separate window, while reading the article here. Incidentally the repository’s Readme gives detailed instructions on how you can get the code running in a couple of minutes!
Let’s get started.
Docker:
- Remark: The docker-compose file is shown below.
- docker compose, currently at
 is of course pretty 😎 as …
- it allows the orchestration of docker containers, volumes and networks.
- Here we have a simple structure with frontend and backend, which have their individual Dockerfiles in their own folders. The folder is specified by the context, with the added benefit of allowing local and thus shorter paths in the individual Dockerfiles such as frontend/Dockerfile backend/Dockerfile.
- Remark: In the individual Dockerfiles pip-compile from the package pip-tools is used to pin the resolved pip-packages given the specifications in the requirements file2.
- Next the ports are passed from inside the docker container to same ports on the host (8501 for the frontend and 5000 for the backend).
- Further the local app volume is mounted inside the container. This is very handy, for two reasons:
- while developing the changes made in the local app folder are immediately reflected in the container, without the need for building or restarting it
- the data saved in the container is reflected on the host. Thus the data is preserved, even if the container is thrown away, e.g. by rebuilding it.
 is of course pretty 😎 as …
version: '3.1'
services:
    frontend:
      build:
        context: ./frontend
        dockerfile: Dockerfile
      ports:
        - 8501:8501
      volumes:
        - ./frontend/app:/app
      depends_on:
        - backend

    backend:
      build:
        context: ./backend
        dockerfile: Dockerfile
      ports:
        - 5000:5000
      volumes:
- ./backend/app:/app- supervisor is very well respected as evidenced by its github stars currently at .
- It can be a real life-saver when coding the Dockerfile. For instance, when a build crashes, it is often tremendously difficult to suss out where it failed. This is because Docker requires the single-purpose-container-service to run, otherwise the container will be killed.
- Supervisor can be that service. Which means, you can then access the running container with supervisor running and find out what was causing the problem. In general, with supervisor you can develop in docker pretty much as if you were on a linux machine.
- Of course, nothing in life comes for free, and supervisor has a footprint. However, if performance or memory are a constraint, supervisor can be removed after finishing development. In our case the supervisor footprint is not problematic, therefore we keep it, both for the backend and the frontend.
- Supervisor is told by a configuration file what to do; for an example of the configuration file see below. In our case we tell the nodaemon to restart on file changes during development, and we tell supervisor to launch gunicorn which in turn launches flask.
 .
.
[supervisord]
nodaemon=true

[program:gunicorn]
command=gunicorn --config config/gunicorn_config.py backend:app
Frontend:
- streamlit currently at is a heavy-hitting newcomer
- claims it is “the fastest way to create apps”
- is still very young, in fact in last October it celebrated its one-year anniversary.
- It’s also pretty fast-moving and already pretty awesome. Recently it featured the introduction of columns/blocks, which we leverage here.
 is a heavy-hitting newcomer
Backend
- d6tflow is derived from spotify’s package luigi
- On its website this description is given: “For data scientists and data engineers,
d6tflowis a python library which makes building complex data science workflows easy, fast and intuitive. It is built on top of workflow manager luigi but unlike luigi it is optimized for data science workflows.” - d6tflow caches the results of tasks in various formats, such as csv of json and many others. You specify the format in the class definition of your Task by deriving it from the corresponding d6tflow classes. For csv and json these are TaskCSVPandas, TaskJson.
- You specify if a Task requires another Task to be completed first, by the decorator @d6tflow.requires above the Task’s class definition (see below the example of Task_getData).
- Here we use it to organize our data processing workflow. We have the following cascade of Tasks:
- Task_getTickers > Task_getData > Task_getPlot
- The cascade implies that Task_getPlot is executed it requires the so-called upstream tasks i.e. Task_getData and Task_getTickers, to have been completed beforehand. This means one of the two scenarios:
- either they have already been executed, in which case the results can be grabbed
- or if they have not already been executed, they will be now, and then the results can be grabbed.
- Realistically some data services will fail some of the time. Error handling should not be implicit, but explicit. Errors should also be explicitly passed on downstream. A simple example which is independent of the rest of the pipeline is given in Task_Dual, which provides an illustration of adding status information to the data, in this case a dataframe.
- On its website this description is given: “For data scientists and data engineers,
 is derived from spotify’s package luigi
@d6tflow.requires(Task_getTickers)
class Task_getData(TaskJson):

    runDate = d6tflow.DateParameter()
    stockticker = d6tflow.Parameter()

    def run(self):

        tickers = self.input().load()
        #assert self.stockticker in tickers.keys(), 'Symbol should be in ticker list'

        out = getData(stockticker=self.stockticker)
        self.save(out)
- swagger
- Wikipedia offers the following description: “Swagger is an Interface Description Language for describing RESTful APIs expressed using JSON. Swagger is used together with a set of open-source software tools to design, build, document, and use RESTful web services. Swagger includes automated documentation, code generation (into many programming languages), and test-case generation.”
- In fact instead of json we use a yaml file to do the specification. The specification of the swagger file results in the swagger ui interface further below.
- swagger references the python function functions in the operationId. It’s a combination of the path and the functionname. E.g. tier1.tickerlist.read refers to the function read defined in the file tickerlist, located in the folder tier1.
- The rest of the yaml itself is pretty self-explanatory, it practically serves as specification and documentation simultaneously.

swagger: "2.0"
info:
  description: This is the swagger file for the backend of the financial-timeseries-dashboard
  version: "1.0.0"
  title: Swagger Timeseries
consumes:
  - "application/json"
produces:
  - "application/json"

basePath: "/api"

# Paths supported by the server application
paths:
  /tickerlist:
    get:
      operationId: "tier1.tickerlist.read"
      tags:
        - "tickerlist"
      summary: "The tickerlist data structure supported by the server application"
      description: "Read the tickerlist as obtained from Wikipedia"
      responses:
        200:
          description: "Successful read tickerlist operation"
          schema:
            type: "array"
            items:
              type: "string"
  /cron:
    get:
      operationId: "run_cron.get_todays_data"
      tags:
        - "cron"
      summary: "Execute the job of getting today's data update"
      description: "Read the tickerlist as obtained from Wikipedia"
      responses:
        200:
          description: "Successful read tickerlist operation"
          schema:
            type: "array"
            items:
              type: "string"
  /plot/{selection}/{plottype}:
    get:
      operationId: "tier1.selection_plot.read"
      tags:
        - "selection_plot"
      summary: "The selection_plot data structure supported by the server application"
      description: "Read the selection_plot with data obtained from yahoo"

      parameters:
        - name: selection
          in: path
          description: selection name such as BAYN.DE and BEI.DE. Remark \
            The corresponding Yahoo tickers are also BAYN.DE and BEI.DE
          type: string
          required: True

        - name: plottype
          in: path
          description: plottype such as scatter, returns or histogram
          type: string
          required: True

      responses:
        200:
          description: "Successful read selection_plot operation"
          schema:
            type: "array"
            items:
              properties:
                data:
                  type: "array"
                layout:
                  type: "array"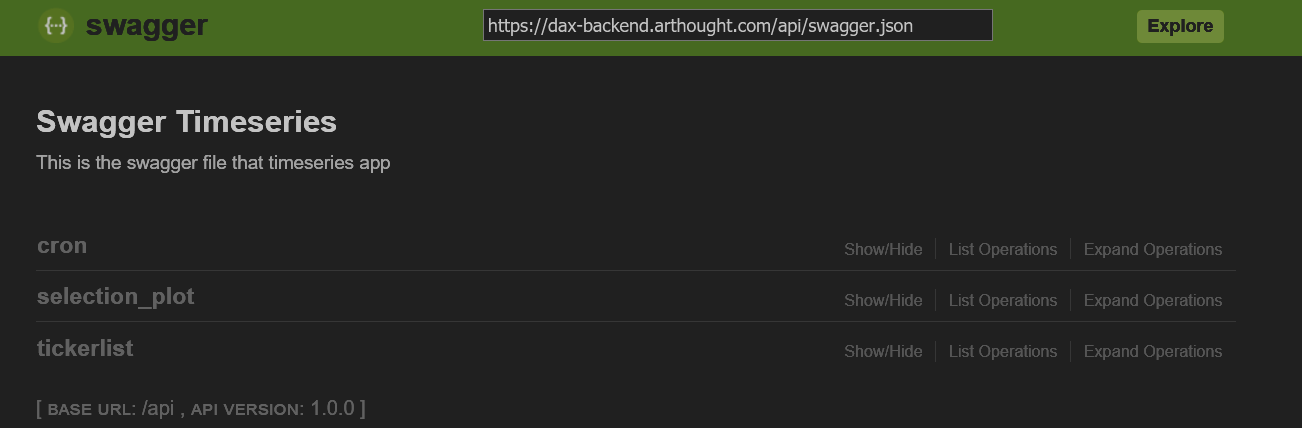
Concluding remarks and outlook
I hope its been as fun for you to read it, as for me to write it. The combined power of docker (including docker-compose and supervisor), swagger, flask and heavy hitting python packages plotly, streamlit, flask and d6tflow really is compelling and provides endless opportunities. One thing has not been discussed here: how to incorporate this into your https-protected site. That might form the topic of a follow-up post. So stay tuned!
This concludes our post.
- 1.Wittmann HF. Git Hub. financial-timeseries-dashboard. Published January 3, 2021. Accessed January 3, 2021. https://github.com/hfwittmann/financial-timeseries-dashboard
- 2.Turner-Trauring I. Faster Docker builds with pipenv, poetry, or pip-tools. pythonspeed. Published November 5, 2020. Accessed January 1, 2021. https://pythonspeed.com/articles/pipenv-docker/